Wednesday 31 October 2018

Halloween Fun!

Today we solved The Mystery of the Missing Mona Lisa, we learned to draw sugar skeleton skulls, played "Mystery Handshake," boo-gied like crazy and competed in a bone bridge competition. 

STEM CHALLENGE
The goal was to create a bridge that holds a black plastic cat. We were only given 20 minutes to work as a team. It was much more challenging then we thought.  Here are some of the final bridges.


Thursday 25 October 2018

Learning about data...


Students will:


  • read data in charts, tables, and graphs (including vertical and horizontal bar graphs)
  • describe the data (e.g., “Most of the data values are different”).
  • interpret data in charts, tables, and graphs
  • Understand and identify mode 
(e.g., “The mode is the value that shows up most often on a graph.”)
  • collect and organize data and display the data in charts, tables, and graphs
Use:
  • vertical and horizontal bar graphs
  • write titles and labels and with labels 


Sample bar graph and description.


Click here to see a video about Pictograph Scales

Data Management


CHAPTER 3- Data Management


Dear Parent/Caregiver:
Your child can practise some activities such as the following:
Tally Charts                                       pages 56-57
Pictographs                                       pages 58-59
Bar Graphs                                        pages 62-63
Communicate about Data              pages 64-65
Mode                                                  review worksheets
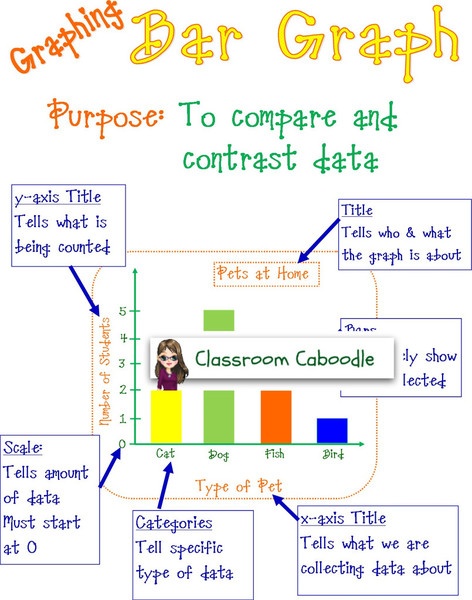
• Your child can design a question, conduct a survey, tally the results, and display the data in a bar graph. For example, they could ask, “How many of my books do I want to read, or read again: soon, someday, or never?” and then interpret the results.
• When sharing a circular item, such as a pie, encourage your child to compare the sizes of slices (cut from the centre); this is similar to a circle graph.
Nelson Web Site at www.mathk8.nelson.com