Students will:
- read data in charts, tables, and graphs (including vertical and horizontal bar graphs)
- describe the data (e.g., “Most of the data values are different”).
- interpret data in charts, tables, and graphs
- Understand and identify mode
- collect and organize data and display the data in charts, tables, and graphs
- vertical and horizontal bar graphs
- write titles and labels and with labels
 |
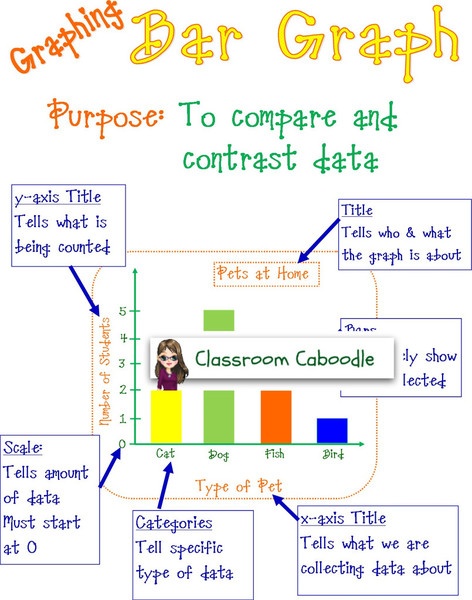
| Sample bar graph and description. |


No comments:
Post a Comment
Note: only a member of this blog may post a comment.